I have been a web developer for approximately 4 and half years, and have worked for two different companies. My main role is to produce gorgeous websites from designs built in Adobe Photoshop, and generally on a tight schedule. I first started back in 2009, when Internet Explorer 8 had just been released just, and a huge part of the audience was still using versions 6 and 7. Google Chrome was already released, but only had about a 4% share of the global users, and as a result was not well known. Internet Explorer 8 did have its own Developer tools, but I mainly used source files to analyse the Document Object Model (DOM), which was a tedious job when something didn’t output quite how you wanted it to. Fast forward to 2015, and Chrome now has the commanding lead over the other browsers, and not just in usage but in speed and capabilities. The one thing I admire most though is its built-in developer tools, which allow me not only to analyse the DOM of any websites, I can also debug the JavaScript, allowing for a faster turnover time in website development.
Over the next few months, I will be talking about most of the highly notable features in Google Development Tools, and how to use them to benefit the development of a website. In this part, I will discuss the basic usage of the DOM Inspector, and viewing and modifying the styles within. All of these are located in the Elements tab.
Diving into the Elements Pane in Chrome Developer Tools
When building a website, I have it so that the Developer Tools will always be on one screen, and the website itself on the other. This allows for fast analysis of the webpage I’m currently on. It can be accessed either by pressing the F12 button or Ctrl/Cmd + Shift + I on the keyboard, opening up the menu and selecting “Developer Tools” within the “More tools” submenu, or right clicking the page and selecting “Inspect element”. If you choose to open it by right clicking, you will jump straight to that element you had the mouse over in the Elements tab:
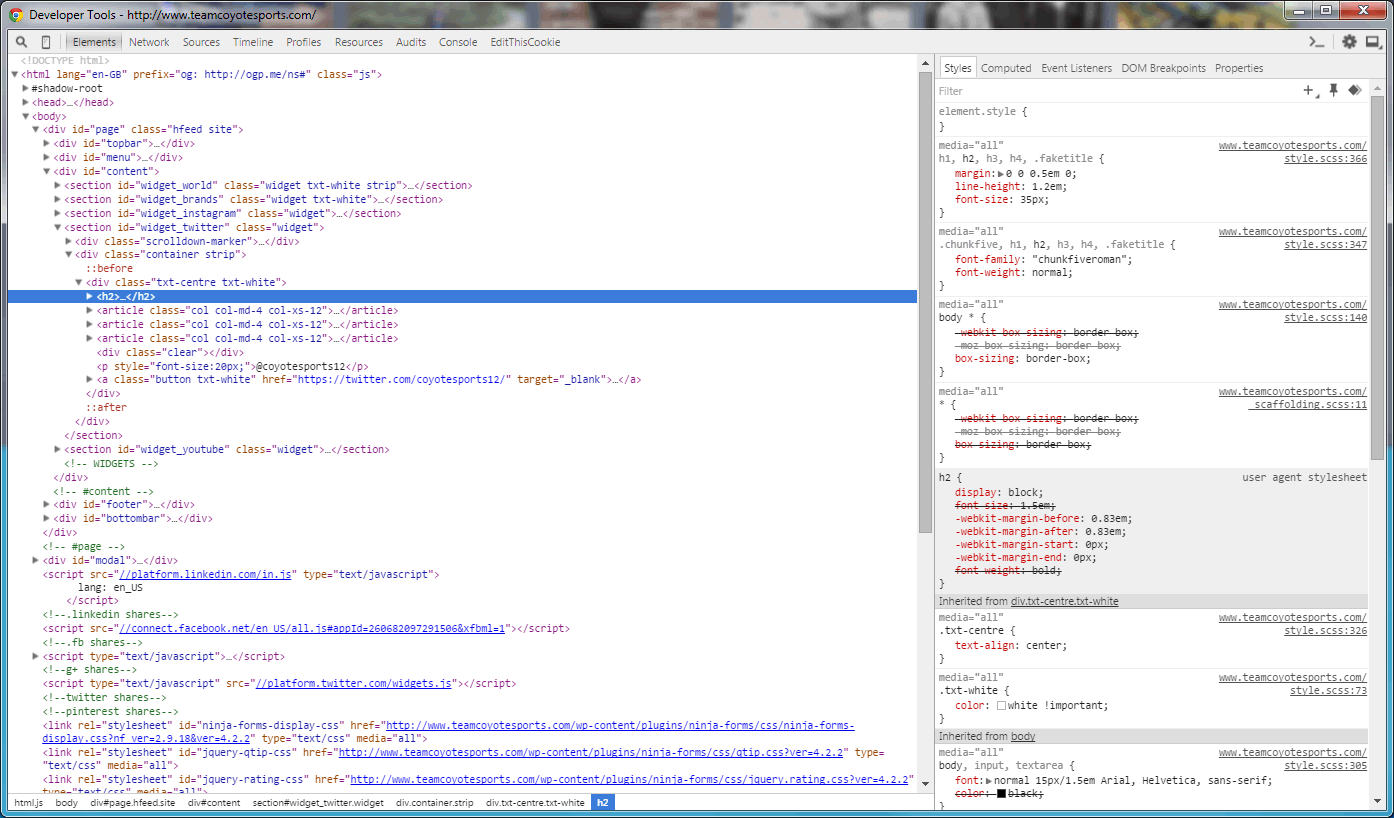
There are a lot of components within the Elements tab, so I shall explain each one.
![]()
Starting with the bottom-left of the Developer Tools, you are presented with the immediate DOM tree, which shows the parent nodes of the inspected element, complete with any ID and class identifiers. You can jump to one in the DOM simply by clicking on it.
 The styles panel to the right shows all the individual styles that have been applied to that element. This in itself is split into five tabs:
- Styles – this displays the styles that have been applied per CSS statement, followed by defaults, and finally inheritance.
- Computed – this shows the box model of the element as well as every single CSS property that’s being applied to it, regardless if it’s been defined or not.
- Event Listeners – this lists all the attached listeners created from JavaScript that’s associated with that element; this is something I rarely used, as I use JavaScript breakpoints instead (more on that in a future post).
- DOM Breakpoints – this shows all the elements that the Inspector is watching for any change
- Properties – this displays all the JavaScript notations that are associated with the element, as well as listing all the available functions you can call against it; this can be useful to inspect attributes that may well only be accessible via JavaScript.
In this post, I will dive into the Styles and Computed tab. The Other three tabs will be explained further when I discuss the JavaScript Console.
Styles Tab
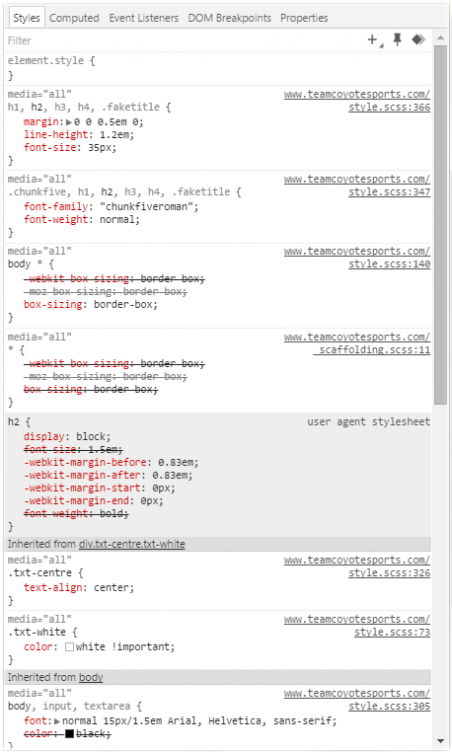 The Styles tab provides a quick yet very detailed glance on how an element is styled. Each section is split into their declarations called Rules, with inline styles showing first, followed by internal style sheets, and finally external style sheets. These will also be ordered from bottom to top, regardless of importance. Next that follows are inherited styles, which are styles that the browser have applied from the start unless overridden, and is highlighted in a grey background. Following this shows the inheritance section, where it defines which element the selection has used for styling as well (for example the H2 has also inherited from both the section parent and the body). The final section shows the pseudo elements that are assigned. There is also a box model towards the bottom, which shows the size of the computed element, as well as its padding, border, and margin.
What has been discussed above, these can be temporarily edited and will show immediate results in the browser window. The only part you cannot do so is the user agent stylesheet section, which is in the grey background. To disable a style, hover over it and uncheck the checkbox that appears; this will be then represented by the style being crossed out, and allows any previously declared styles that have been overridden to be used. To change a value, simply click it and type in the intended change. Any named representative of a style will appear in a drop down, and will initiate autocomplete on what has been typed in so far; to accept this, press either Tab or return, and it will be used. You can change a numeric value in increments by clicking on it and pressing either up or down on the keyboard to increment or decrement the value by one respectively. You can also press and hold Alt to make changes in tenths (0.1), or Shift to make changes in tens. Finally, you can press the Page Up and Down buttons to make the changes in tens, or press and hold Shift whilst doing so for changes in hundreds.
 The Colour Palette
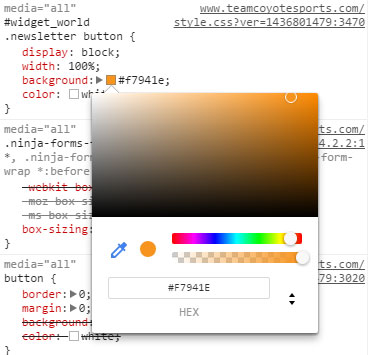
Colours can be changed as the above, but by clicking on the square colour, it allows you to select from a palette. If you wish, you can click the dropper icon to activate the colour picker, and simply select the desired colour on the webpage. If you want to view the colour in its alternate formats, you can either Shift-click the colour box, or click the toggle button to cycle through RGB, HSL, and hexadecimal variants. If you have adjusted the transparency of the colour, then only RGBA and HSLA are available.
 Edit Animations with the Cubic Bezier Editor
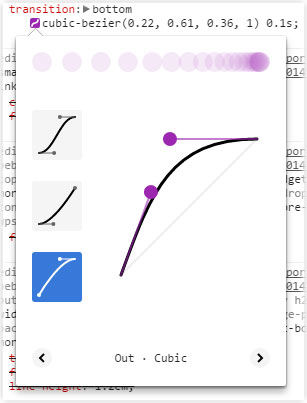
One notable new feature in CSS3 are animations, which can be done without JavaScript. Chrome Development Tools provides simple to use yet powerful features to view and fine tune the motion of the animation (also known as the transition). Within any CSS declaration that uses animation, click on the purple box with a white line inside to open the cubic bezier editor. This demonstrates the transition, which includes its live movement, the path, and the name. The live preview will only play once, but it can be clicked to restart the animation. To choose a different transition, select a movement type from the previews to the left, and then click the arrows towards the bottom to cycle through them. Once selected, it can be tweaked by dragging the purple handles to vary the speed and direction at different intervals.
Filter those Styles
As sites get larger, the amount of styles declared will often increase as well. If there is a style you need to alter but are unsure of where it was declared (for example an inherited font size), this can be typed into the filter box towards the top just below the Styles tab. If the Developer Tools find any matches, then it will show the complete CSS rule with the matches highlighted, and any that are unmatched will be hidden. The filter also works for element attributes and property values.
Make Temporary Edits in Stylesheets
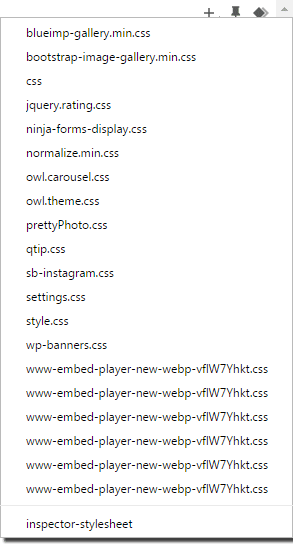 It is common for an element in the DOM to not have any styling assigned to it whatsoever, so as a result no direct rules will appear in the Styles tab. Instead of having to return to your stylesheet to add it in, you can press the plus button to the right of the filter textbox to create a temporary rule for it. By default, the selector it will declare will be the element type, plus either an ID, or one (or multiple) classes, if available. The selector can be modified to tailor the website, for example if you want to select the element by a previous element, and then followed by a child selector. It also defaults to adding the style into the Inspector Stylesheet, which is Chrome’s built-in stylesheet for temporary edits. Inline styles are the only styles that can override the ones that are declared in this stylesheet.
If you prefer to witness the changes like as if the rule was declared in a physical stylesheet, then this can be achieved by clicking and holding the New Style Rule button and releasing over the preferred stylesheet it lists. This is useful for when you want to see the changes if it was in a stylesheet you’re working on. It will act like as if it has been appended to the end of the file.
See Those Pseudos
HTML elements can have CSS pseudo selectors that only become active under a certain condition, and perhaps the most common one used being the hover state. Chrome Developer Tools makes it easy to force any element into one of these states and show the styling for it. This is particularly useful for elements that have additional styling attached to their hover states, and the mouse cannot be kept over the element for the duration. To toggle these pseudo states, select the desired element, and click the button with the pin on next to the New Style Rule button. You will be presented with four options;
- Active – when the element is clicked on, but resets upon clicking off
- Hover – when the mouse is over the element
- Focus – when the element is selected by means of either keyboard or mouse input
- Visited – when the URL attached to a hyperlink has been visited in the past
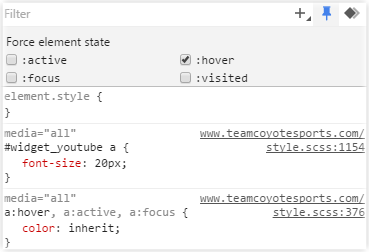 To activate a pseudo selector, click the label to check it, and again to uncheck it. You can activate more than one if you want to see multiple states activated at once. You can also achieve this by right clicking the element within the DOM Inspector, hover over “Force element state”, and choose from the submenu that appears. Every selected state will appear within the Styles tab, and then can be viewed and temporarily modified like any other element.
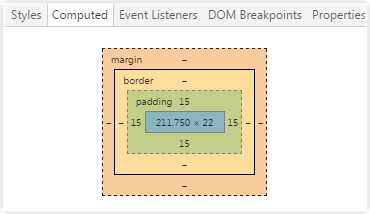
Computed Tab
The Computed tab lists all the styles that have been assigned to the selected element. The tab also displays a box model that represents the sizes of each individual segment of an element. These are always defined in pixels, even if a different unit or a percentage is used to represent the size. Each segment can be modified by double-clicking the required value and typing in the new value, even if it has not yet been defined (this will be represented with a dash). All modifications will appear within the Styles tab within the inline styles section towards the top.
 Underneath the box model, the styles for the selected element are displayed. By default, every single style possible is shown, with any that are faded indicating that this is what the browser has assigned by default. To hide these and only display those that have been defined, uncheck the “Show inherited” box. Any element that has text inside it will also show its rendered font, which is useful for those that have many fonts assigned to it and you let the browser choose which one it should use. For any property, you can reveal where it was defined in the styles by hovering over it and clicking on the magnifying glass icon that appears to the left. By doing so, the Development Tools will jump back to the Styles tab, complete the search filter with the property you have chosen, and highlight them from within the styles as described previously.
That’s all for now, folks!
I was considering including JavaScript debugging within this post, but after 2000 words I shall leave it here before it starts looking like an essay! For any web developer who prefers Google Chrome, the Chrome Developer Tools is an essential piece of kit that will make building websites much easier. What has been discussed here is only the tip of the iceberg. As the months go on, I will discuss further in detail the additional tabs at the top, and eventually how all of them can be used to effectively debug a web page.
It’s JavaScript debugging next, but for now thank you for reading this post, and I hope you have picked up on a style or two!

Pingback: 10 Useful Tools for Creating Fantastic Websites | Fantastic Media()